Inspiration Station Vol. 25 – The Realisation of Data
The world runs on data. Around a decade ago, our digital footprint started to get bigger and bigger… And it’s showing no sign of stopping thanks to our web searches, social media, apps, and well pretty much anything that requires electricity. Everything from your phone to your toaster is now mining your precious data. As a result, the global big data market has now passed $49bn (Statista).
With the Internet of Things, advancements in AI and facial recognition on the rise, not to mention an increasingly remote audience plugging in to engage with brands, the power of our data will only continue to grow. With it, so will the opportunities available. Businesses will shift from being data-generating to data-powered, making use of actionable data and business insights.
In the world of B2B, this means data-driven decision making, more insightful integration of marketing and sales, and perhaps most importantly, hyper-personalisation.
In the world of brand experiences and online audiences, this means we are on the cusp of a full-blown revolution. Here’s why…
AI
Machine learning is a rapidly developing technology that’s becoming more sophisticated with every passing year. We are yet to see its full potential. Particularly when combined with big data.
Experts believe that computers’ ability to learn from data will improve considerably due to more advanced algorithms, deeper personalisation, and cognitive services.
There will be machines that are better capable of reading emotions. This could signal an exciting new era of responsive storytelling in which content is shaped around our likes and dislikes in real time.
Data Gate
Ouchhh are a pretty cool LA based studio who blend science, art and technology. This 15 ton installation consists of three parts; Form, Light and Space – utilizing machine learning to interpret NASA’s Kepler satellite’s data (which documented 2,662x planets, 61x supernovae and 530,506x stars in its 9 year voyage!) to bridge the gap between humans and the habitable parts of the universe.
DATAMONOLITH
What would happen if the the world’s most ancient data and AI came together in the name of hybrid architectural art?
Well, wonder no more, because Ouchhh have combined data from the pre-pottery Neolithic period (9600–7000 BC to be exact) with artificial intelligence to create a 3 billion-pixel digital monolith to breath life into our origins.
Latent Being
Latent Being was one of our favourite art experiences of 2019. The AI installation tracked visitor behaviour and combined the data with algorithms to shape an immersive ”hallucination” of Berlin. AI artist Refik Anadol created the first collective unconscious of the city. It featured projections of 10,000 archival and contemporary photographs of Berlin, a geometric laser representation of the AI’s neural network, and an AI-processed soundtrack fusing Berghain’s famous techno, street sounds, radio chatter and even older sound recordings.


Visitors were given a tracking device. Later, projected squares appeared on the floor that followed them in real time. Along with location data and movement patterns, the artificial intelligence records how long visitors spend in the installation, to influence the images and pace of the show. The piece culminates in the reveal of how the algorithm imagines Berlin—mind bending images of the city that melt from green-roofed neoclassical cathedrals to brutalist concrete structures.
Biometrics
The use of wearable technology is increasing (some may argue practically a modern-day necessity due to their convenience and affordability). This means that soon, brands will be able to track emotional and physiological states, as well as geolocation and behaviour based data, to construct more precise customer profiles.
In the not-to-distant future, wearables will provide biometric feedback as nuanced as how much a person’s heart rate or body temperature altered while looking at something very specific. Not only will this type of detail enhance brands’ ability to fine-tune future events: it will actually mean real-time adjustments can be made.
Brands could deliver personalised content through visitors’ smart glasses based on how they’re feeling. If their smart watch detects that they’ve made a certain number of steps, glasses could push notifications through about the nearest seating area. They’ll even be able to tell you who’s in each zone, so you can look for networking opportunities.
Klik
Klik specialise in events-specific wearables such as wrist bands, badges and vinyl sleeves, which not only enhance the event experience for attendees (think more streamlined networking) but also provide a wealth of valuable data for event organisers. Using zone and session tracking combined with interaction analysis, organisers are better able to create personas to design more insightful experiences. It even allows for more enhanced retargeting post-event.
In a post-covid era, the concept of face-to-face interaction needs to be redesigned to keep people as safe as possible. While Klik can be used to create a safe and memorable in-person experience, they even offer an online platform to better serve remote audiences.
Gaze Recorder
Advances in machine learning and computer vision, allow us to track eye movements with high precision using just a webcam. Technology like Gaze Recorder allows you to see user engagement in real time so that you can track audience attention, getting to know your brand perception and marketing communication performance. It also means you can create catchy ad campaigns, improve your creative and increase website conversions.
Try it for yourself by uploading something here. Or simply copy this code into your website to start tracking your audience’s eye movements.
Data Visualization
With so much data out there in the digital ether, it can be hard to make sense of it all. Often people can switch off when presented with stats, and sometimes the humble pie chart just isn’t going to captivate audiences.
Engaging visual representations draw audiences into the data, provoking them to explore it. Data visualization provides a deeper meaning to the numbers.
Symulakra
PanGenerator also created a similar digital sculpture in Warsaw, Poland. A simulacrum is a simulated of reality, a creation of its own reality or even a supernatural being in three-dimensional form. The installation was influenced by data from cell phones of people gathered around the exhibit (the of use of mobile internet and age demographic data) as well as traffic. Visitors could also directly influence the shape of the sculpture using a dedicated mobile website.
The Shimmering Pulse
Art-collective PanGenerator were commissioned to display the real-time data of Shenzhen traffic in the form of a kinetic sculpture. The Shimmering Pulse takes inspiration from nature, with patterns of movement that can be observed in flocks of birds or shimmering schools of fish – a fitting metaphor for the pulsing life of the city. Each of the 451 modules react to light projection mapped onto them in response to traffic, with the hexagon divided into sections corresponding the nine city districts.
Spotify Wrapped
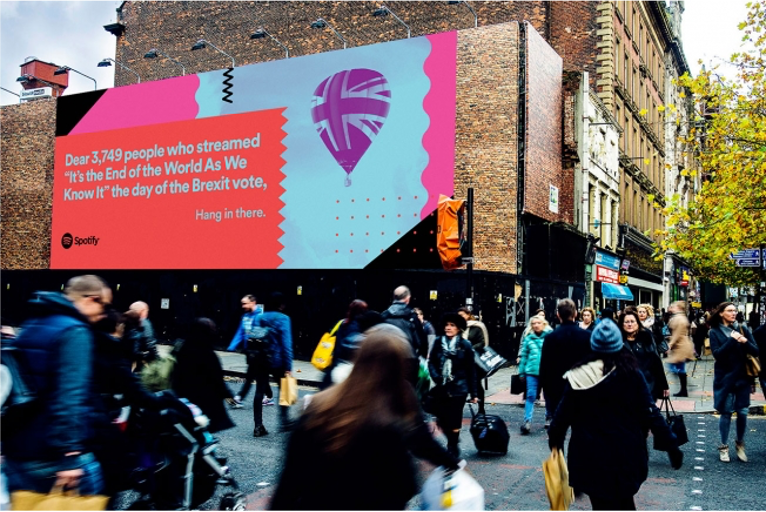
We’ve mentioned before how Spotify utilize their data to connect with their audiences: Their annual “Wrapped” feature is extremely popular as it allows users to explore their own musical journey through their listening insights. They’re also pretty good at harnessing that same wealth of data to create relatable, humorous and engaging campaigns.
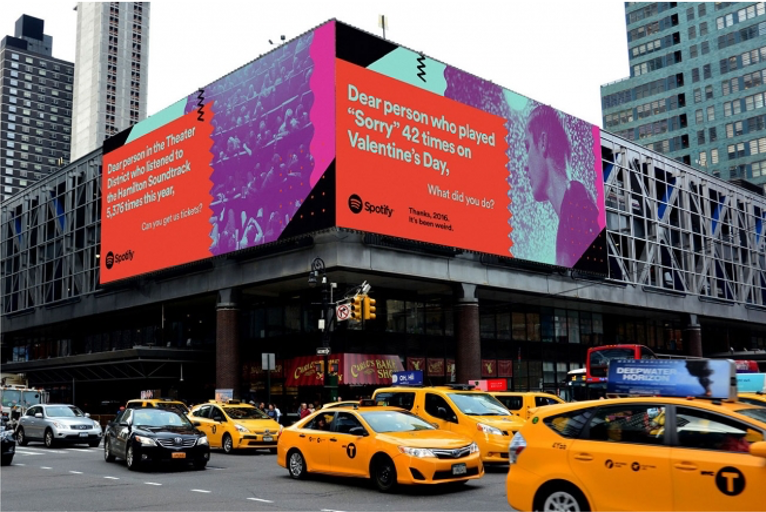
Ads have included observations in their data such as ‘Dear person who played “Sorry” 42 times on Valentine’s Day, What did you do?’ and ‘Dear 3,749 people who streamed “It’s the End of the World As We Know It” the day of the Brexit vote, Hang in there.’ By using listener data, Spotify is able to create unique campaigns that can be localized based on area. Which are apparently highly effective; as subscriptions met a record high after their release across regions.
Data Capture
Nothing in life is free and personal data is digital gold for brands. That’s the price we’re all paying for everything from newsletters, social media and apps, to entering competitions, brand activations and even… billboards? Yes billboards. But how does a billboard capture data you might wonder? Brands such as 7-Eleven, Coca-Cola and HSBC bank are increasingly turning to facial recognition to attract and engage a distracted audience.
Cleverly disguised cameras capture images of passersby and apply statistical analysis to identify audience demographics, reactions and moods. Big brother concerns aside, this actually has numerous positive applications for hybrid brand experiences. Webcams mean that event organisers can now capture real-time feedback, down to the most specific moments, and AI will even soon evolve the guest experience by generating enhanced content in response to these reactions, using facial recognition algorithms.
I’m Lovin’ it Live

To better market to younger audiences, McDonalds hosted a virtual music festival with the likes of Stormzy, Lewis Capaldi and Jess Glyne. The concerts were the conclusion of a week-long event involving other live events featuring popular football players and a holiday book club for young readers.
It’s a smart way to capture data for the harder to reach 11-24 year olds which they struggle to target. In order to attend, users had to download the My McDonald’s app and make an account.
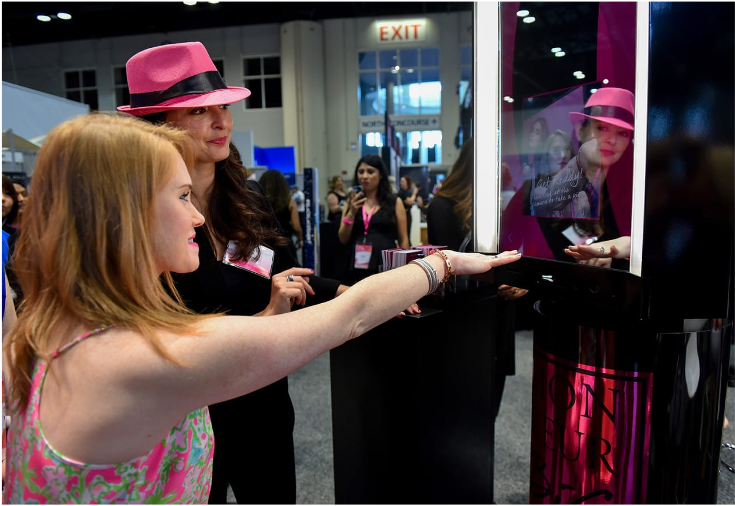
Lancôme
Brands such as Disney, Mazda and Nestlé, even the Super Bowl, have been using facial recognition for years to capture and record behavioral data in response to their products.
Lancôme offered a facial recognition kiosk where visitors could register for the experience. The kiosk captured their likeness in addition to makeup and style preferences, contact information and social media handles. That’s a lot of data! Finally, gestural smart mirror technology and the facial recognition data worked in tandem to deliver a virtual makeup try-on experience, along with personalized product recommendations and customized digital content.
Disney

You may be aware Disney Research use a facial recognition system to track how audiences are enjoying movies. AI then uses that data to actually predict how members of the audience will react. But that’s only the beginning…
With nearly a century of content on its hands, Disney must organise its library more carefully than ever. So they’re building machine-learning tools to automatically tag content to make the archiving process more efficient. Now, writers and animators can easily search for everyone from Mickey Mouse to Modern Family’s Phil Dunphy. Even ESPN’s personalisation team are now keen to get in on the action for their app and website content.
So, if the platform knows you’re a fan of the Los Angeles Dodgers or Chelsea FC, it can use the metadata tags to ensure you are served content most aligned to your preferences. Additionally, the machine-learning algorithms can power more advanced AI to drive further personalisation based on behaviour.
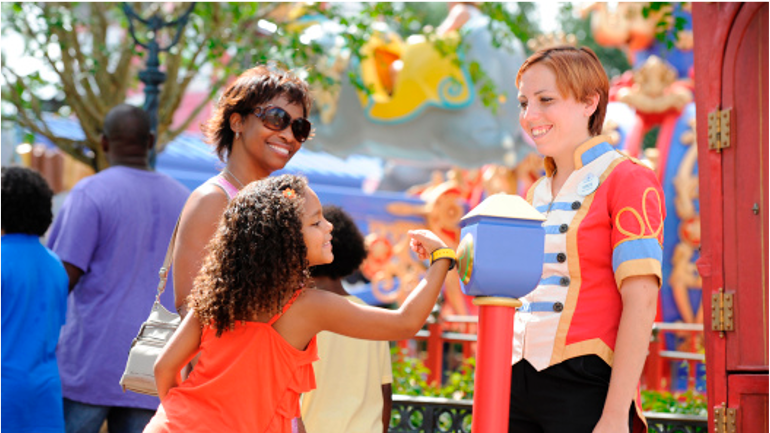
Perhaps the most relevant to brand experiences is Disneyland itself. Disney monitors usage of its smartphone apps and electronic wrist-worn MagicBand to not only keep the parks running with extreme efficiency but actively learn about guest behaviour.
Here’s where it gets really interesting. It’s the resulting data the MagicBand produces, from the rides families visit to the characters they favour, which provides Disney with the most valuable insights. The popularity of certain attractions can signal which movie franchises are rising or falling in popularity. That could inform whether a movie can sustain more sequels, be used to promote the upcoming Disney+ streaming service or perhaps is in need of a refresh.
This may explain why Disney is reportedly investing more into its theme parks than it spent to acquire Pixar, Marvel and Lucasfilm, combined.
Final Thoughts
We couldn’t let you go without squeezing in just a couple of final pieces of data inspiration…
Data visualization has become an art form. Check out these Ted Talks from pioneering artists who use spreadsheets and digital data as their paint and canvas. Find out more here.
DJs of the Future Don’t Spin Records—They Write Code. “Live-coding” parties are the latest phenomenon in underground electronic music culture. Find out more here.
Find out more about the future of facial recognition and the impact on smart cities in this future focused overview here.
Penn State scientists used data from vegetation, climate change, and ecological models to build a VR forest—with both present-day and 2050 versions. Here’s a video walkthrough.
More than a brand experience agency, we help companies communicate, motivate, engage and express their brand personality.
Brand Experience Agency | London | Dublin | NYC | Digital Events | F2F Experiences | Hybrid
+44 (0)203 960 2000